
This guide is also available as pdf [click here].

Overview of SenzoLive
Our SenzoLive dashboard provides you with real-time accurate data. Our advanced software is easy to use and intuitive. It allows you to interpret the data collected from the SenzoUnits and make informed decisions around your workplace optimization. The Live View is a kiosk feature that allows you to view the real-time occupancy of the workplace and see how it is being utilized.
Getting Started
Access to the website
As a B2B solution, SenzoLive’s user access is available exclusively through a request from our contact person and clients. Once the request has been made, an invitation will be sent to the user with a personal link to sign-up for the website. The link will be valid for 24 hours before expiration.
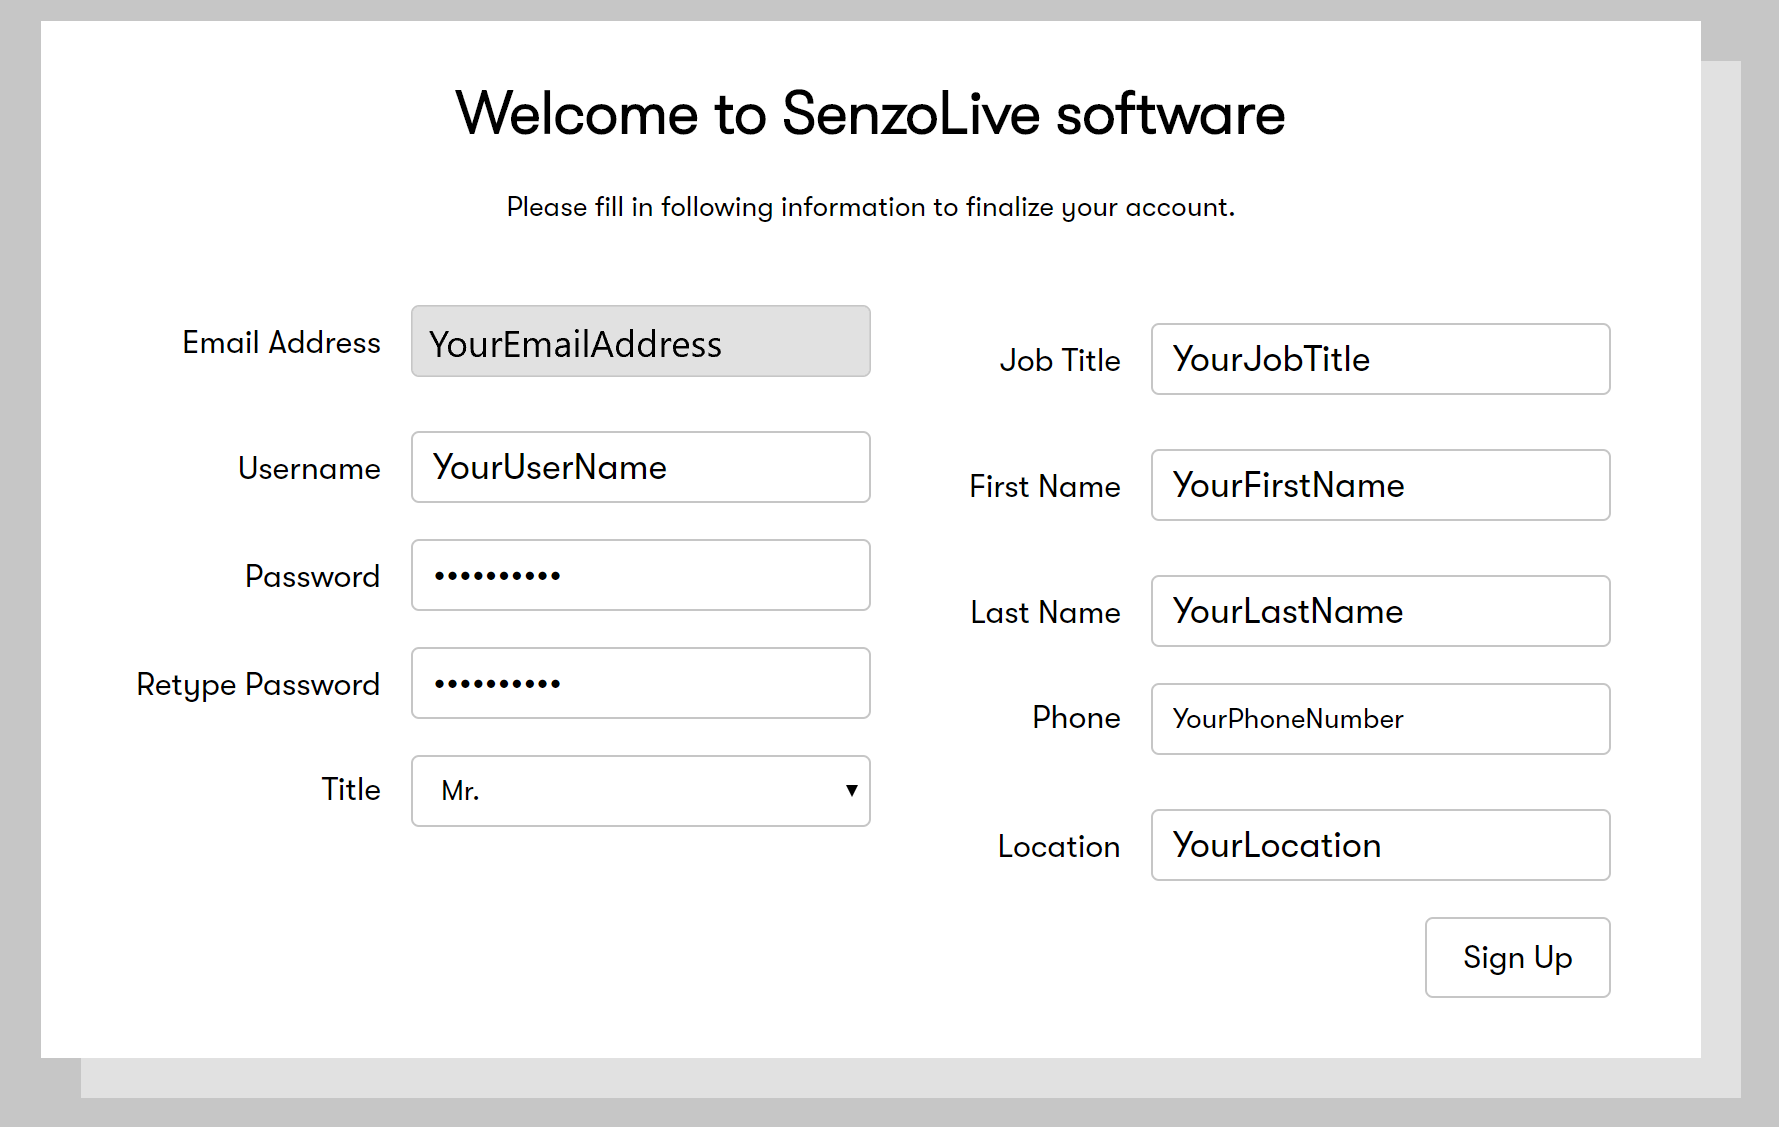
Once the sign-up is done, the page will redirect to https://software.senzolive.com
Overview of the platform
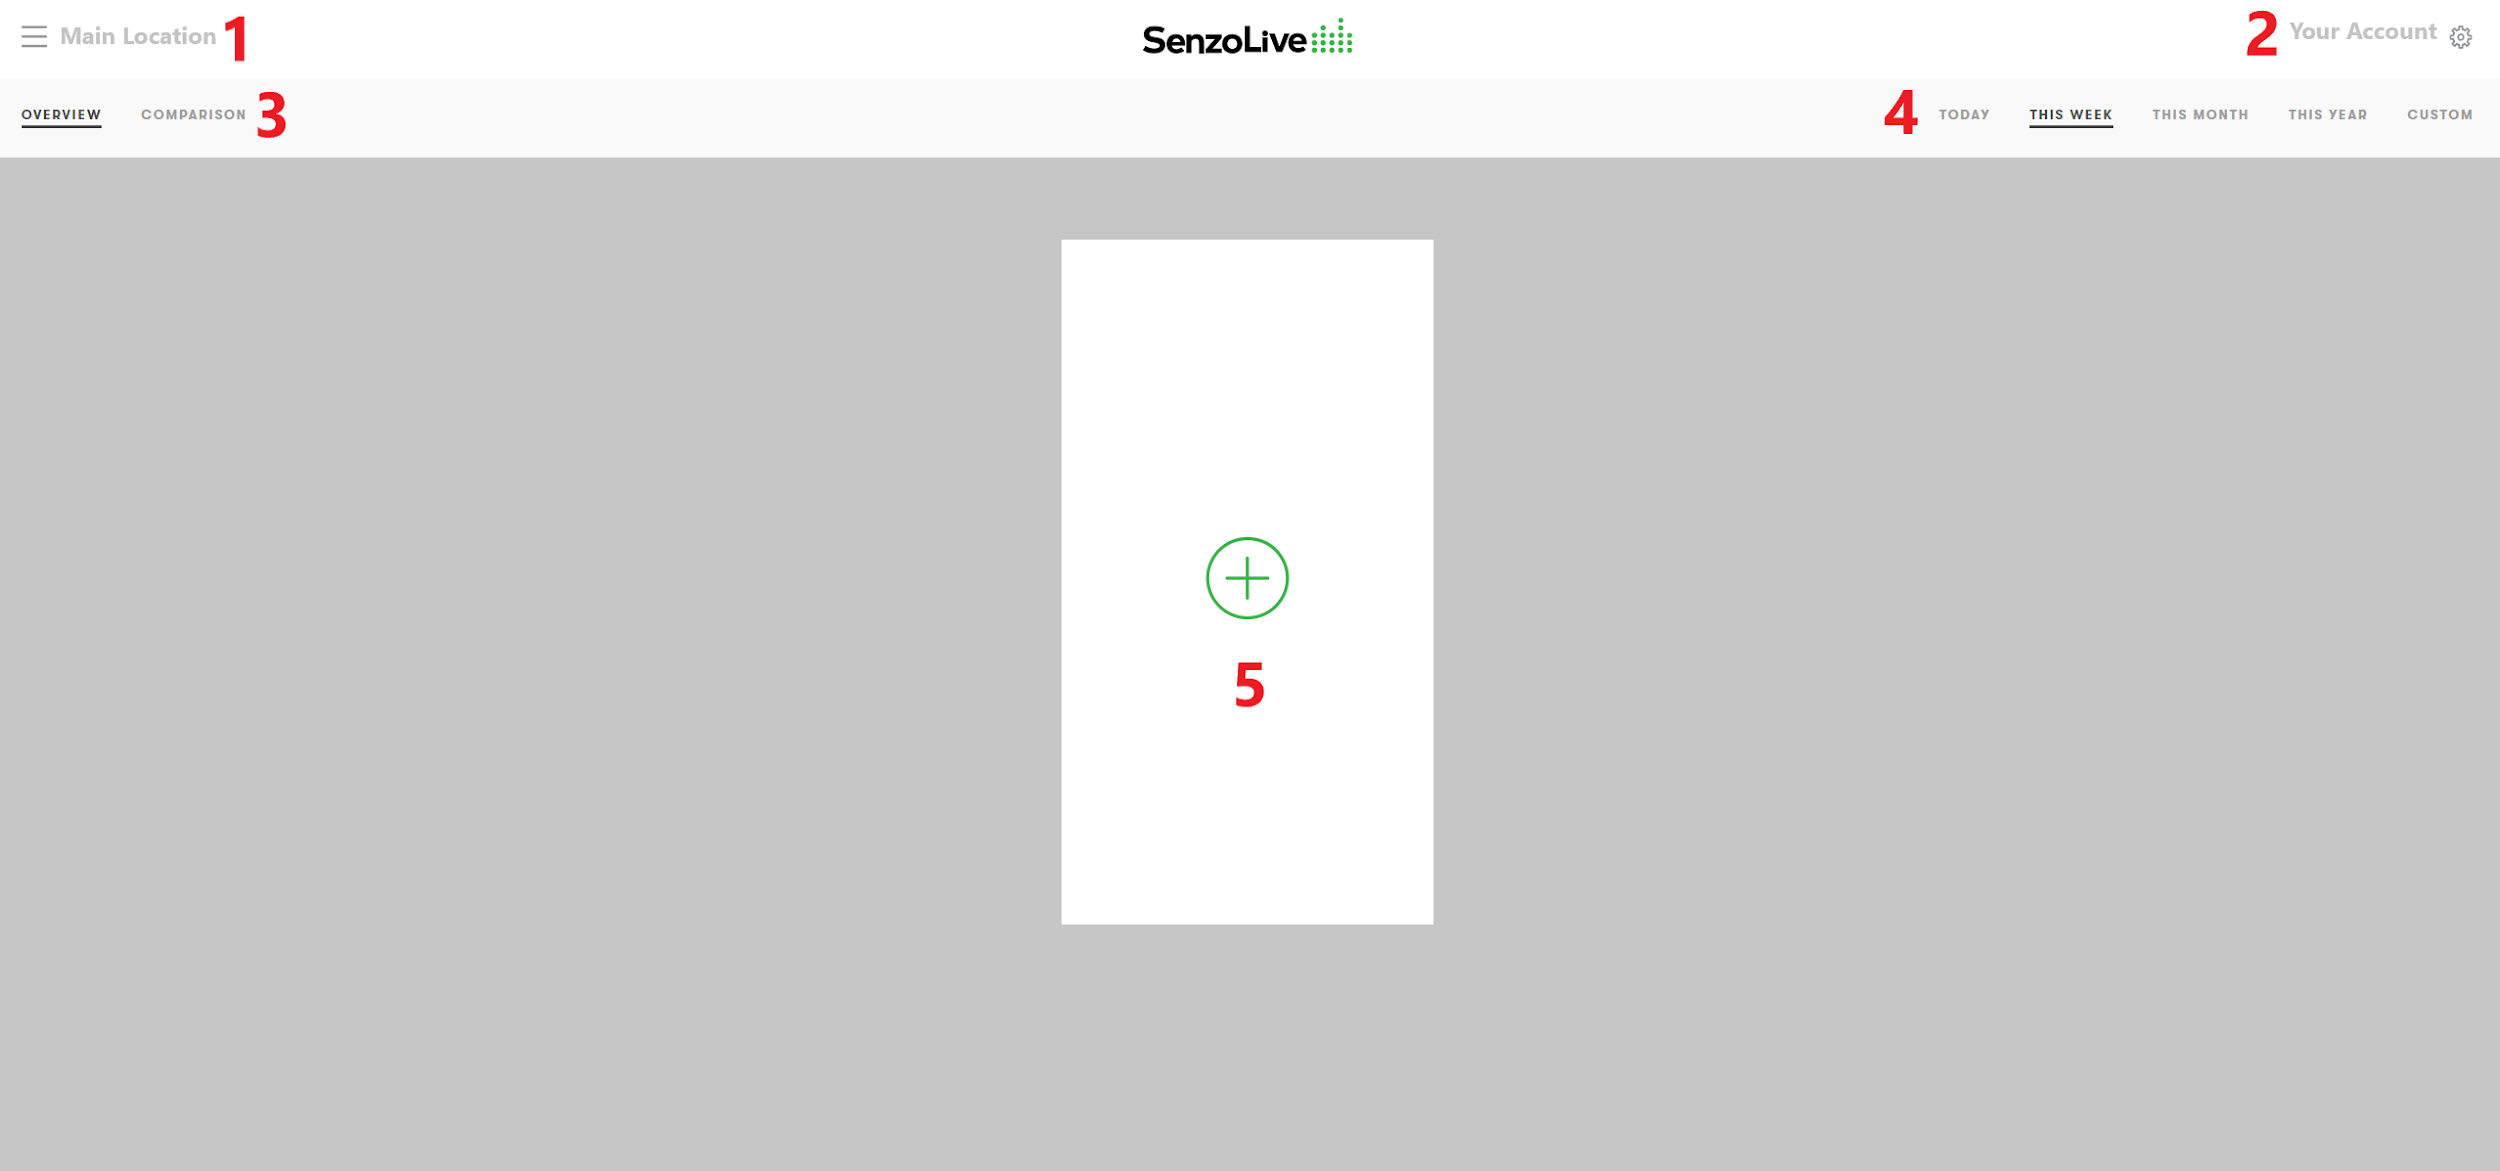
- On the top left corner, the information of all locations is displayed. Clicking on the location leads the user to the Statistic View.
- On the top right corner, the information of the user is displayed.
- Overview: Display data of individual location on the dashboard.
- Comparison: Display comparison information between two locations.- The range of data is chosen to display on the dashboard. “Custom” is used to vary the range of shown data.
- “Add location”: Select the location widget that the user wants to display on the homepage.
Settings
All of the settings are placed on the top right corner next to the username. The number of settings will vary depending on the role of users. There are 4 roles:
- Company Administrators: All settings are available.
- Local Administrators: All settings are available.
- Local Users: Own Account/ Contact/ Livefeed are available.
- Support: Own Account/ Contact/ Livefeed are available.
This part will explain all available settings from the Company Administrators's point of view.
Own Account
Information filled in the sign-up step could be changed here in this setting. Remember to “Save Changes” to take them into effect immediately.
User Administration
This setting is available for Company / Local Administrators. These users can add new accounts and modify the roles of each individual.
Location Settings
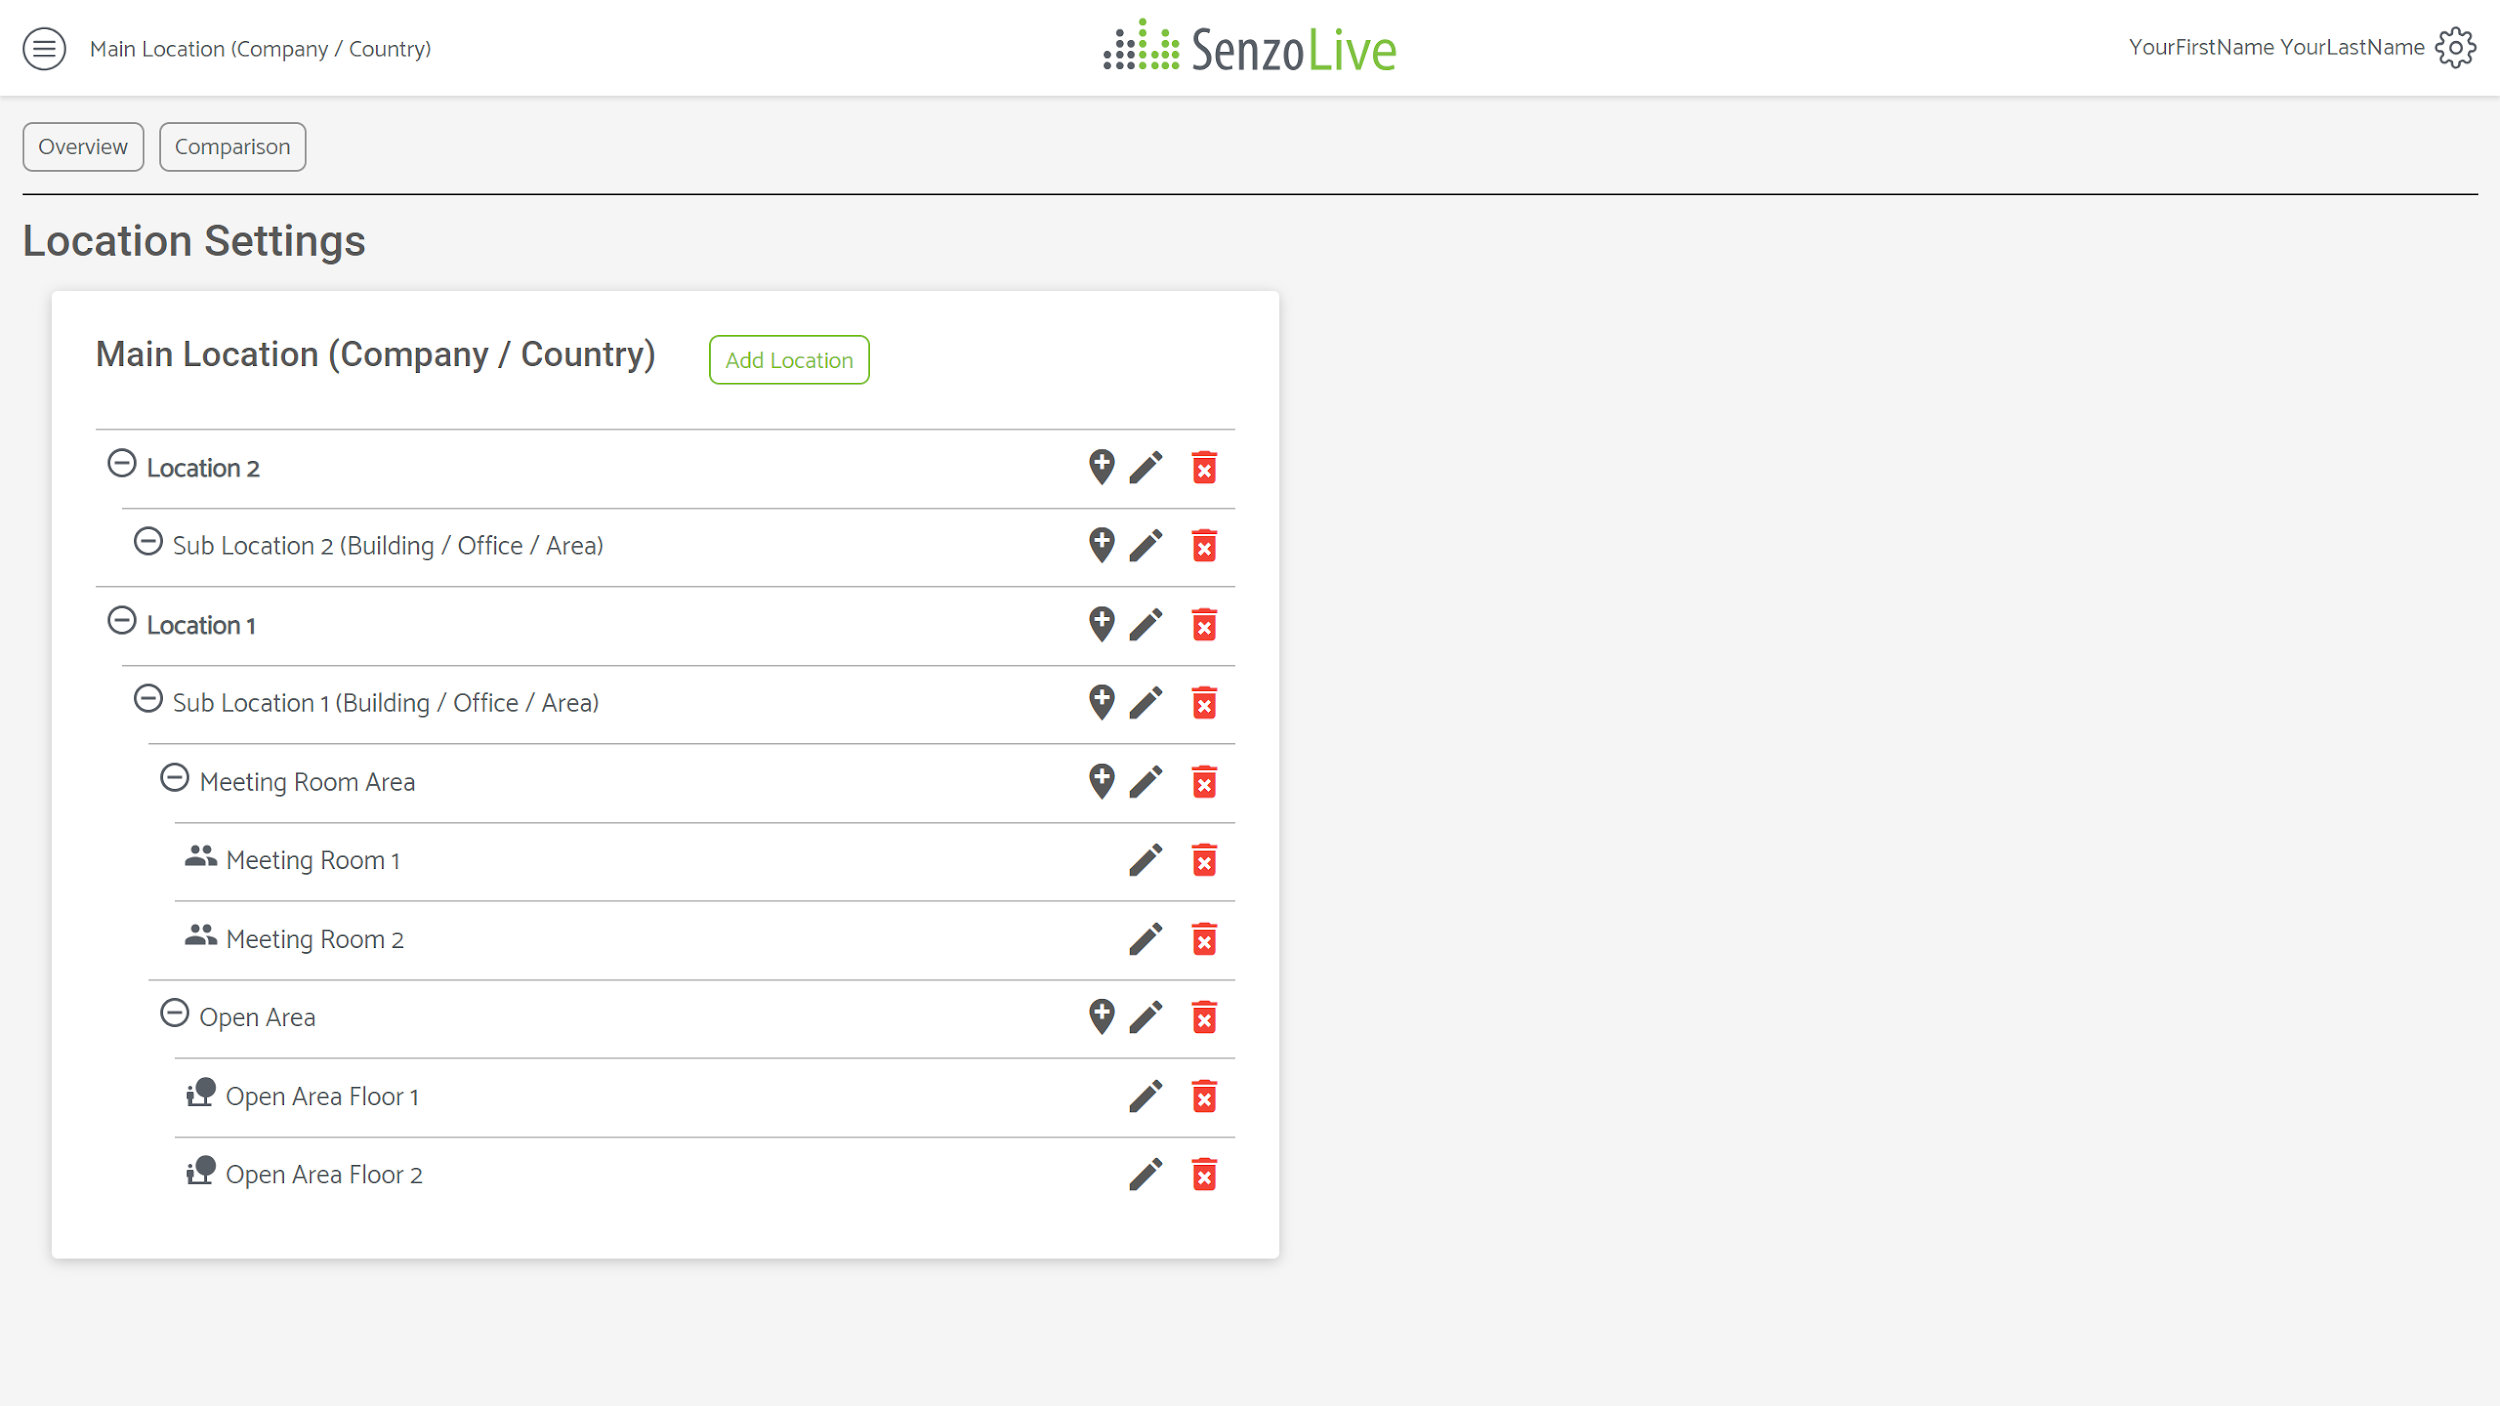
Building a hierarchy to show the relationship between locations. It is important to prepare a draft location tree beforehand to easily create one on the website.
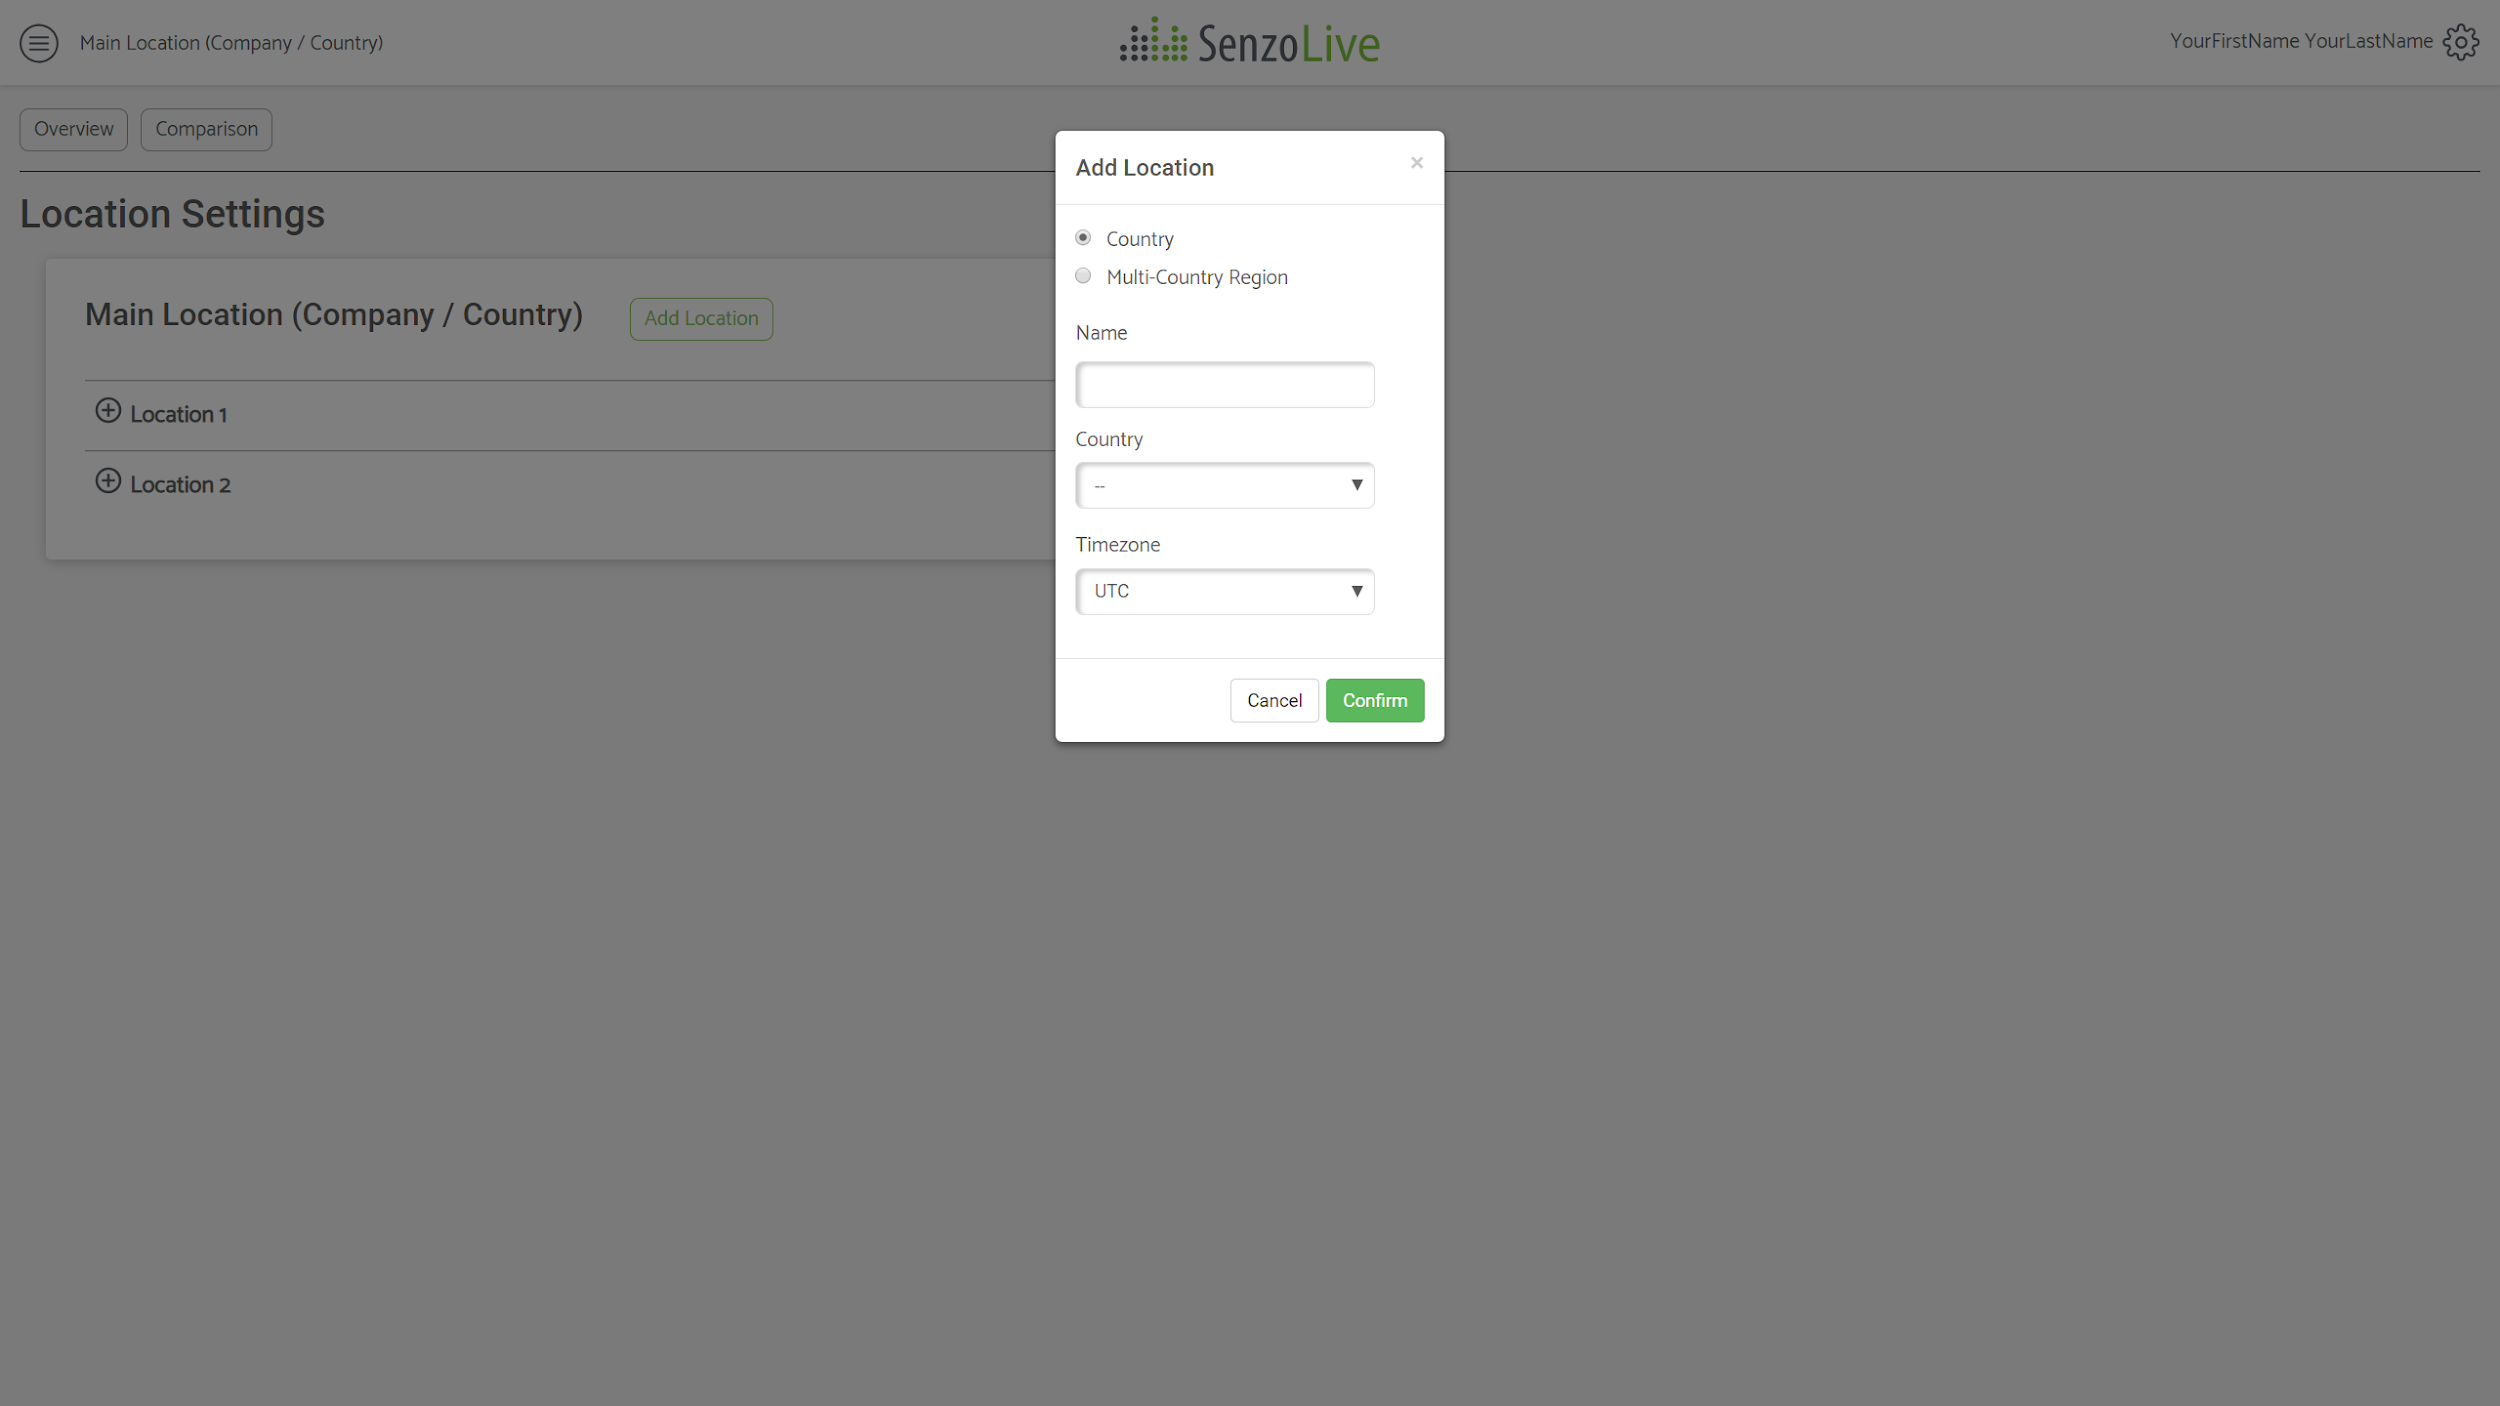
- Add a Top location
A green button next to Main Location is used to add a Top location. It could be a building name, branch, center, or even country. A pop-up window will appear with the required information. Fill in the blank and press “Confirm”. In the figure below, “Location 1” and “Location 2” are examples of Top location.
Building the hierarchy
There are 3 buttons (from left to right) ![]() to add, edit, and delete a location. Once the user has the tree prepared, from the Top location, use the
to add, edit, and delete a location. Once the user has the tree prepared, from the Top location, use the ![]() button to start adding the sub-locations. A similar pop-up window will appear with the addition of the “Location” tab. There are 2 values in this tab: Sub location for adding a level below and Top location for adding a new level above. In this step, adding a “Sub location” is chosen.
button to start adding the sub-locations. A similar pop-up window will appear with the addition of the “Location” tab. There are 2 values in this tab: Sub location for adding a level below and Top location for adding a new level above. In this step, adding a “Sub location” is chosen.
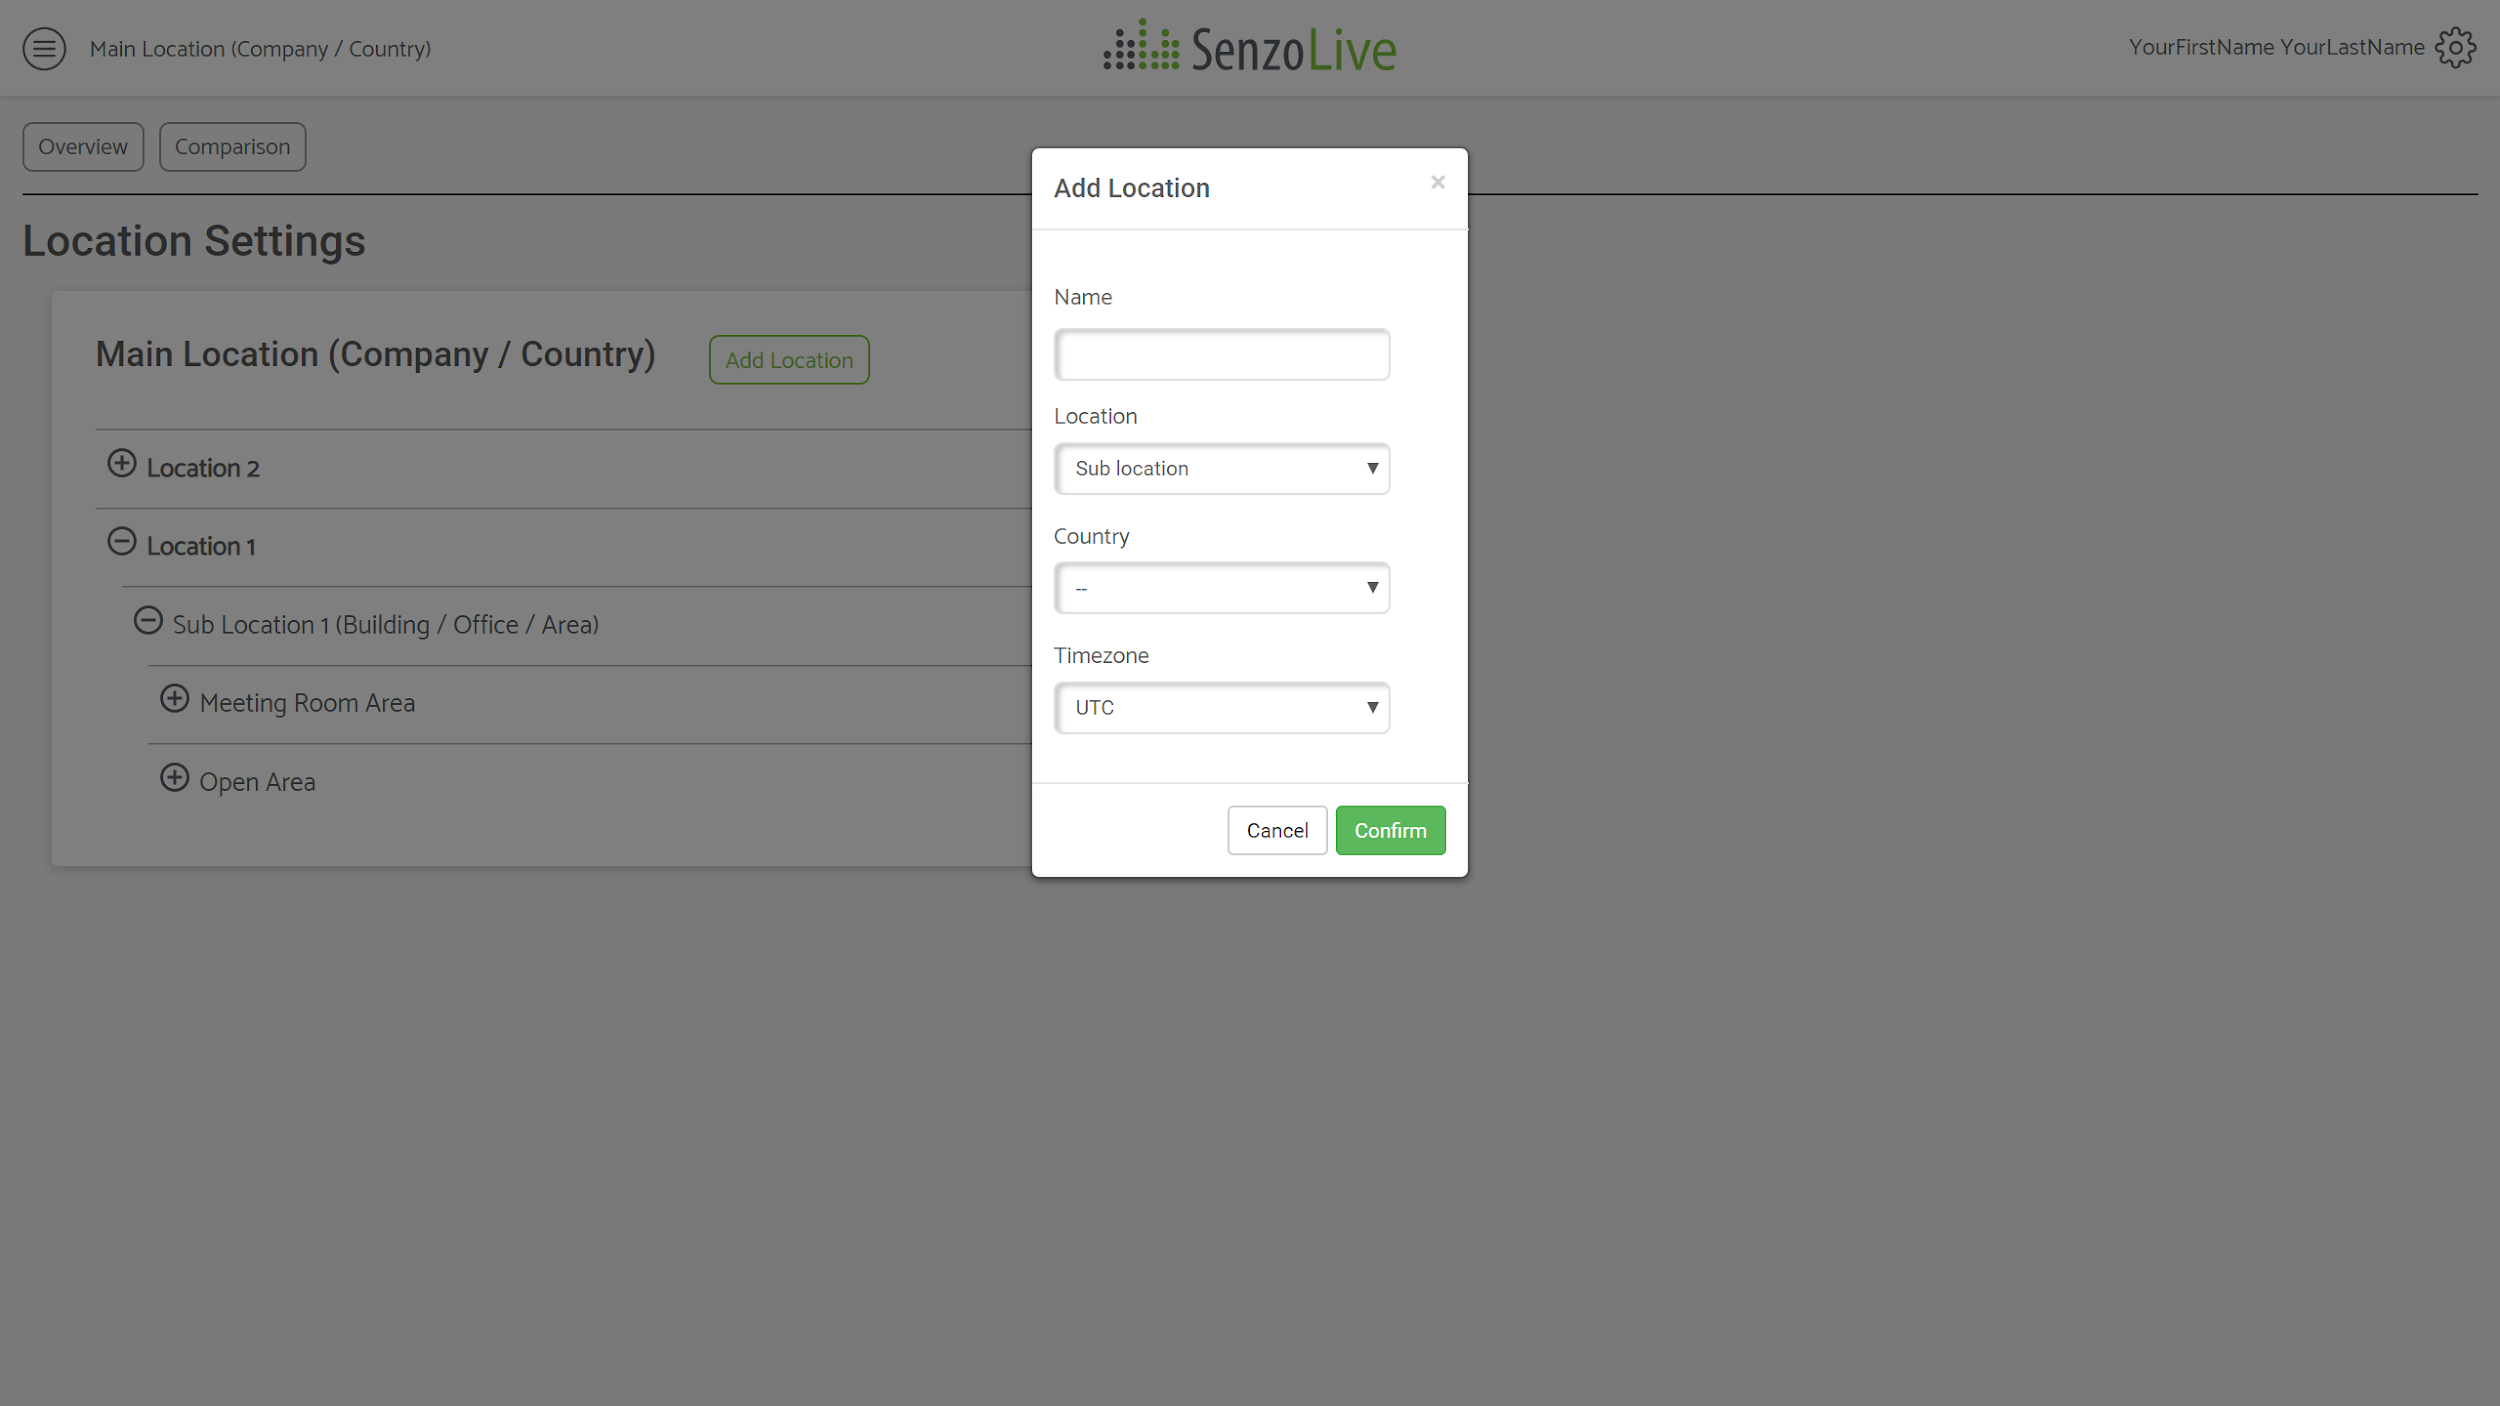
For example, A general hierarchy contains a Top location, x amount of sub-locations in which divided into Meeting Room Area and Open Area. Finally, the lowest layer will be the name of the rooms. Figure 5 will show an example.
In order to change the name of a location, use the ![]() and select “Edit location”.
and select “Edit location”.
Adding a floor plan
A floor plan is added only once in the Top location and can be set to be used for all sub-locations. In order to add a floor plan, the user chooses ![]() at the Top location and select the “Edit Floor Plan”.
at the Top location and select the “Edit Floor Plan”.
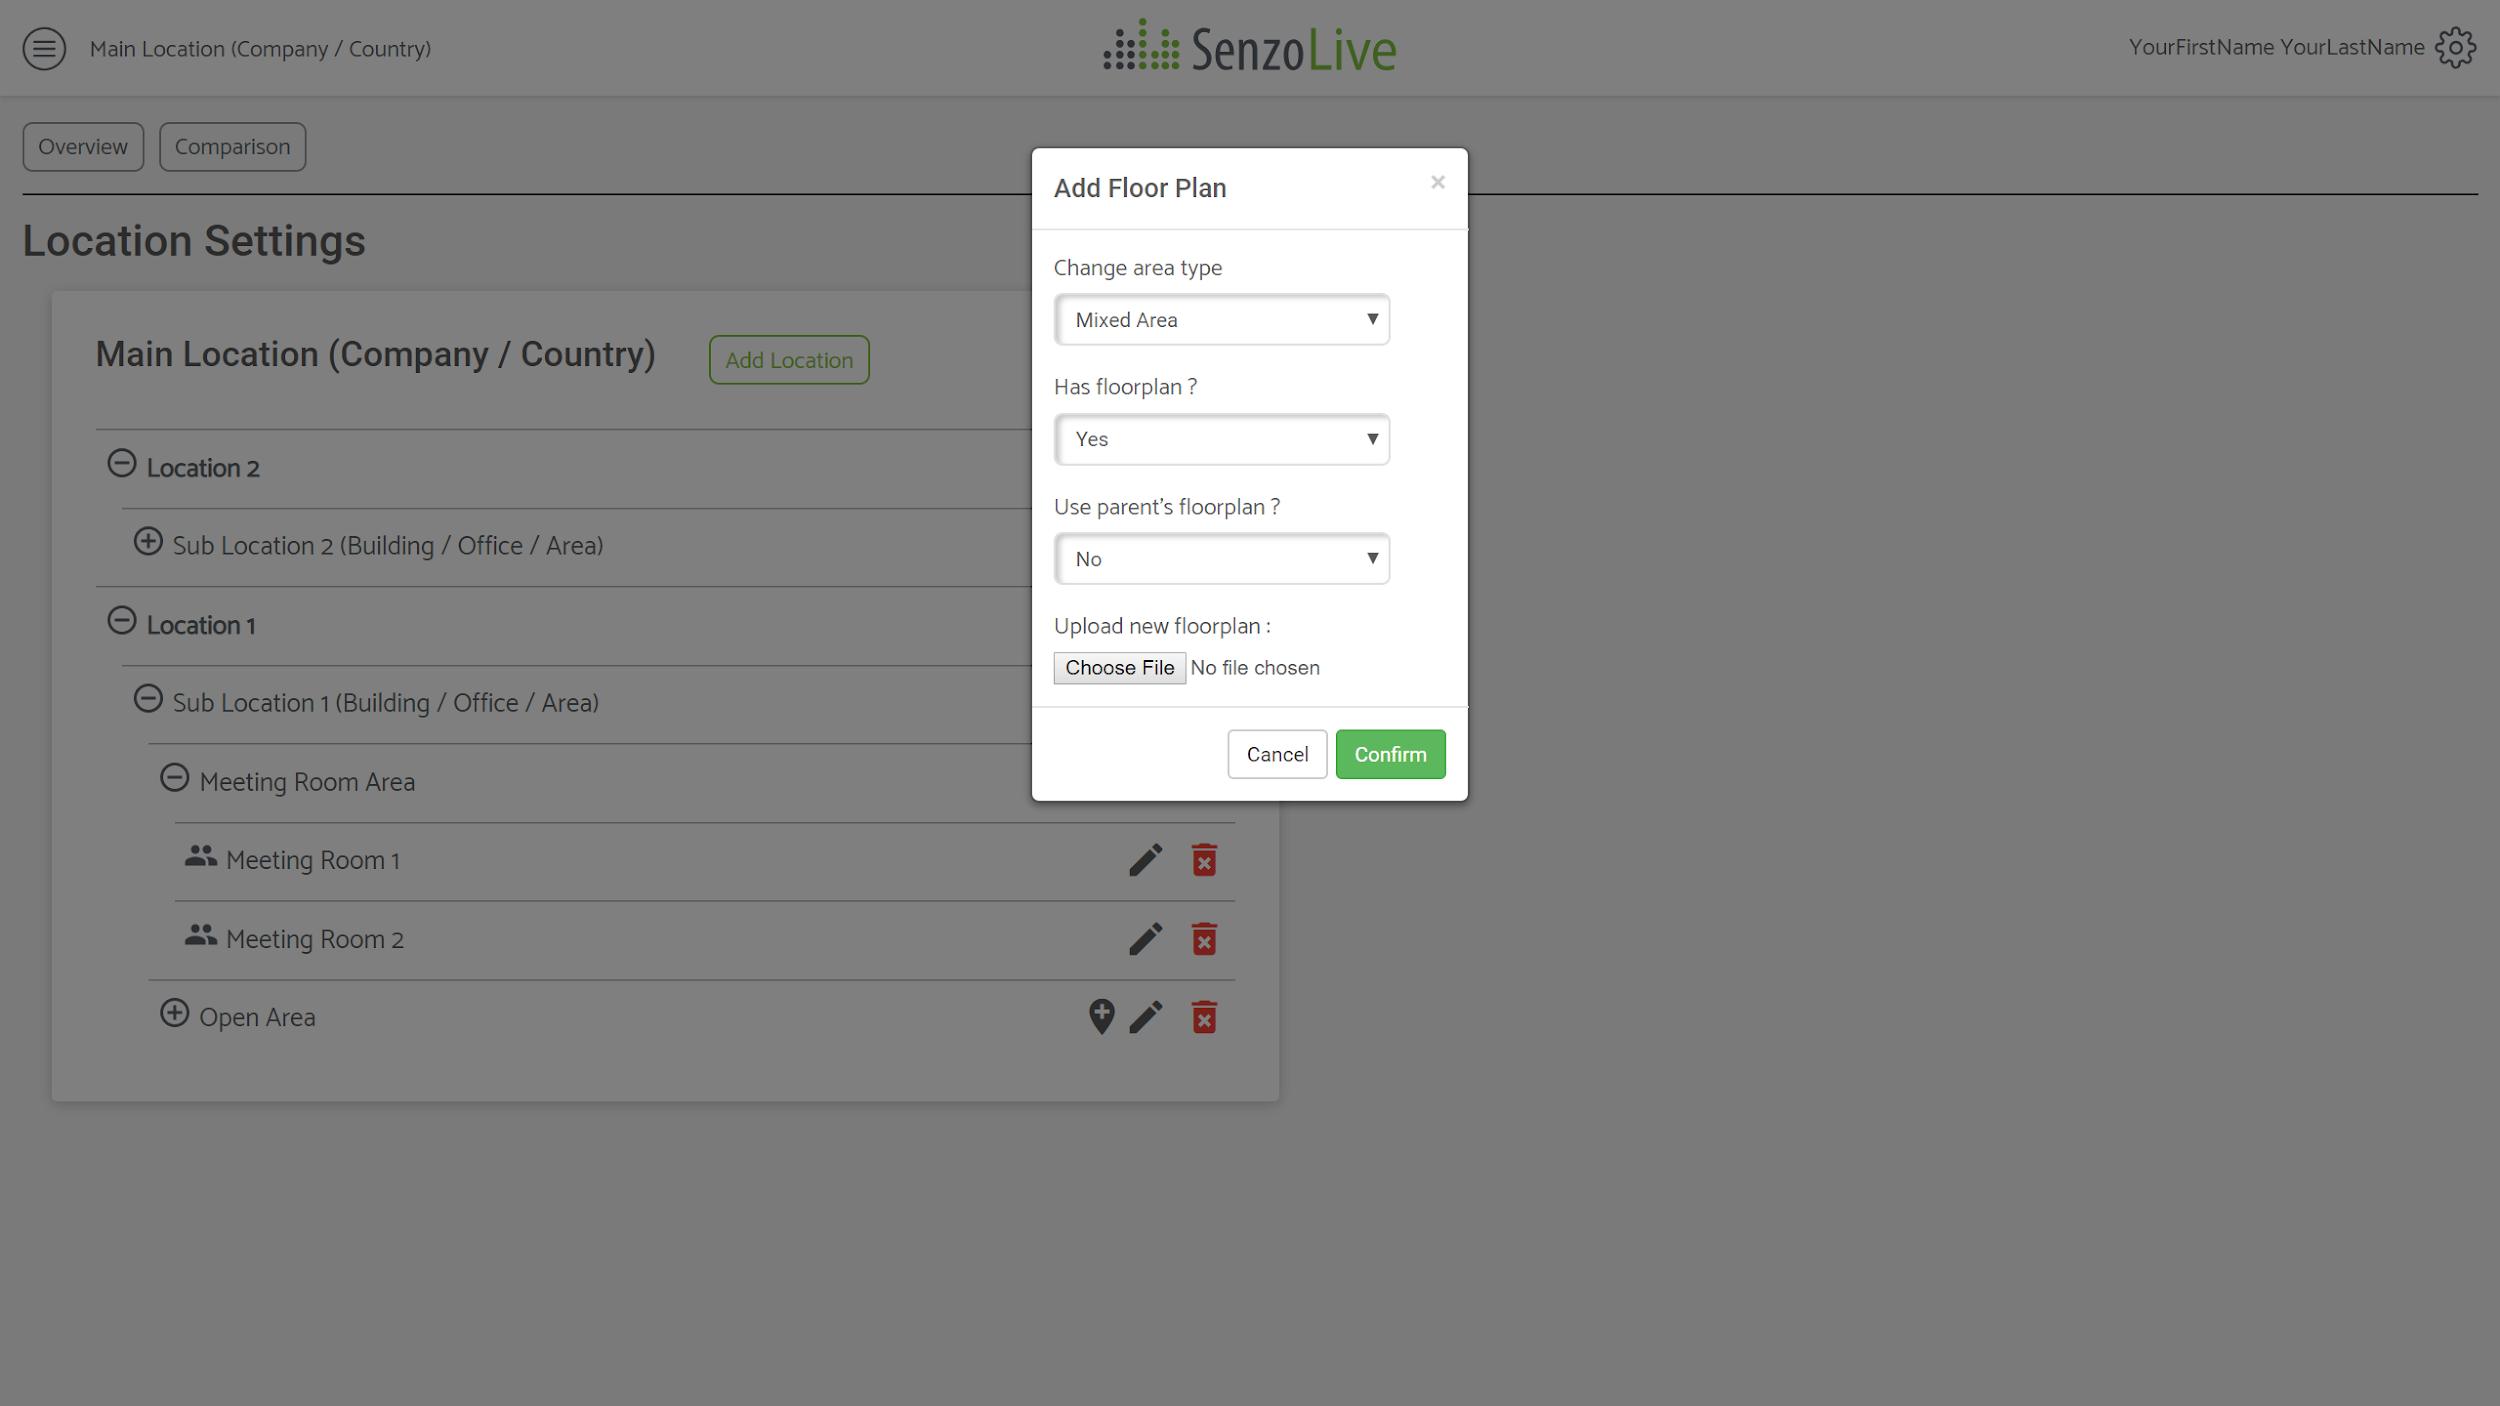
There are 4 information tabs:
- Change area type: There are 3 options (Mixed Area / Meeting Room / Open Area).
Important Notice: Only choosing Mixed Area allows users to continue adding sub levels, therefore, all levels must be kept as Mixed Area until the last layer which is the name of rooms. - Has floorplan? : Choose “Yes” if a floor plan should be added here, otherwise choose “No”.
- Use parent’s floorplan? : Choose “Yes” if the floorplan is added beforehand, otherwise choose “No”.
- For the first time using the software, there is no floor plan available yet, choose “No” to manual add it. After that, if the same floorplan is used for sub-locations, choose “Yes” to automatically reuse the file.
- Already has floorplan. Upload and replace: This tab appears when the previous one was chosen “No”. Any still image format is applicable. 3D files or PDFs are not suitable. A symbol
 to indicate this level contains a floor plan image. Finally, press “Confirm” to update.
The final step is to change the last layer to the Meeting Room ![]() or Open Area
or Open Area ![]() . After this step, it is not available anymore to add any level below.
. After this step, it is not available anymore to add any level below.
Add Sensor
Sensors are added directly to the floor plan so this function is available only for locations with this symbol ![]() . Adding sensors can be done by choosing
. Adding sensors can be done by choosing ![]() and select “Add Sensor”. The website will redirect to the floor plan view.
and select “Add Sensor”. The website will redirect to the floor plan view.
To start adding sensors, choose the ![]() icon on the top right corner, it will generate a “dot” which equivalent to a sensor. Select the location of the sensor and left-click directly on the floor plan. A pop-up window will appear prompting for the sensor’s information.
icon on the top right corner, it will generate a “dot” which equivalent to a sensor. Select the location of the sensor and left-click directly on the floor plan. A pop-up window will appear prompting for the sensor’s information.
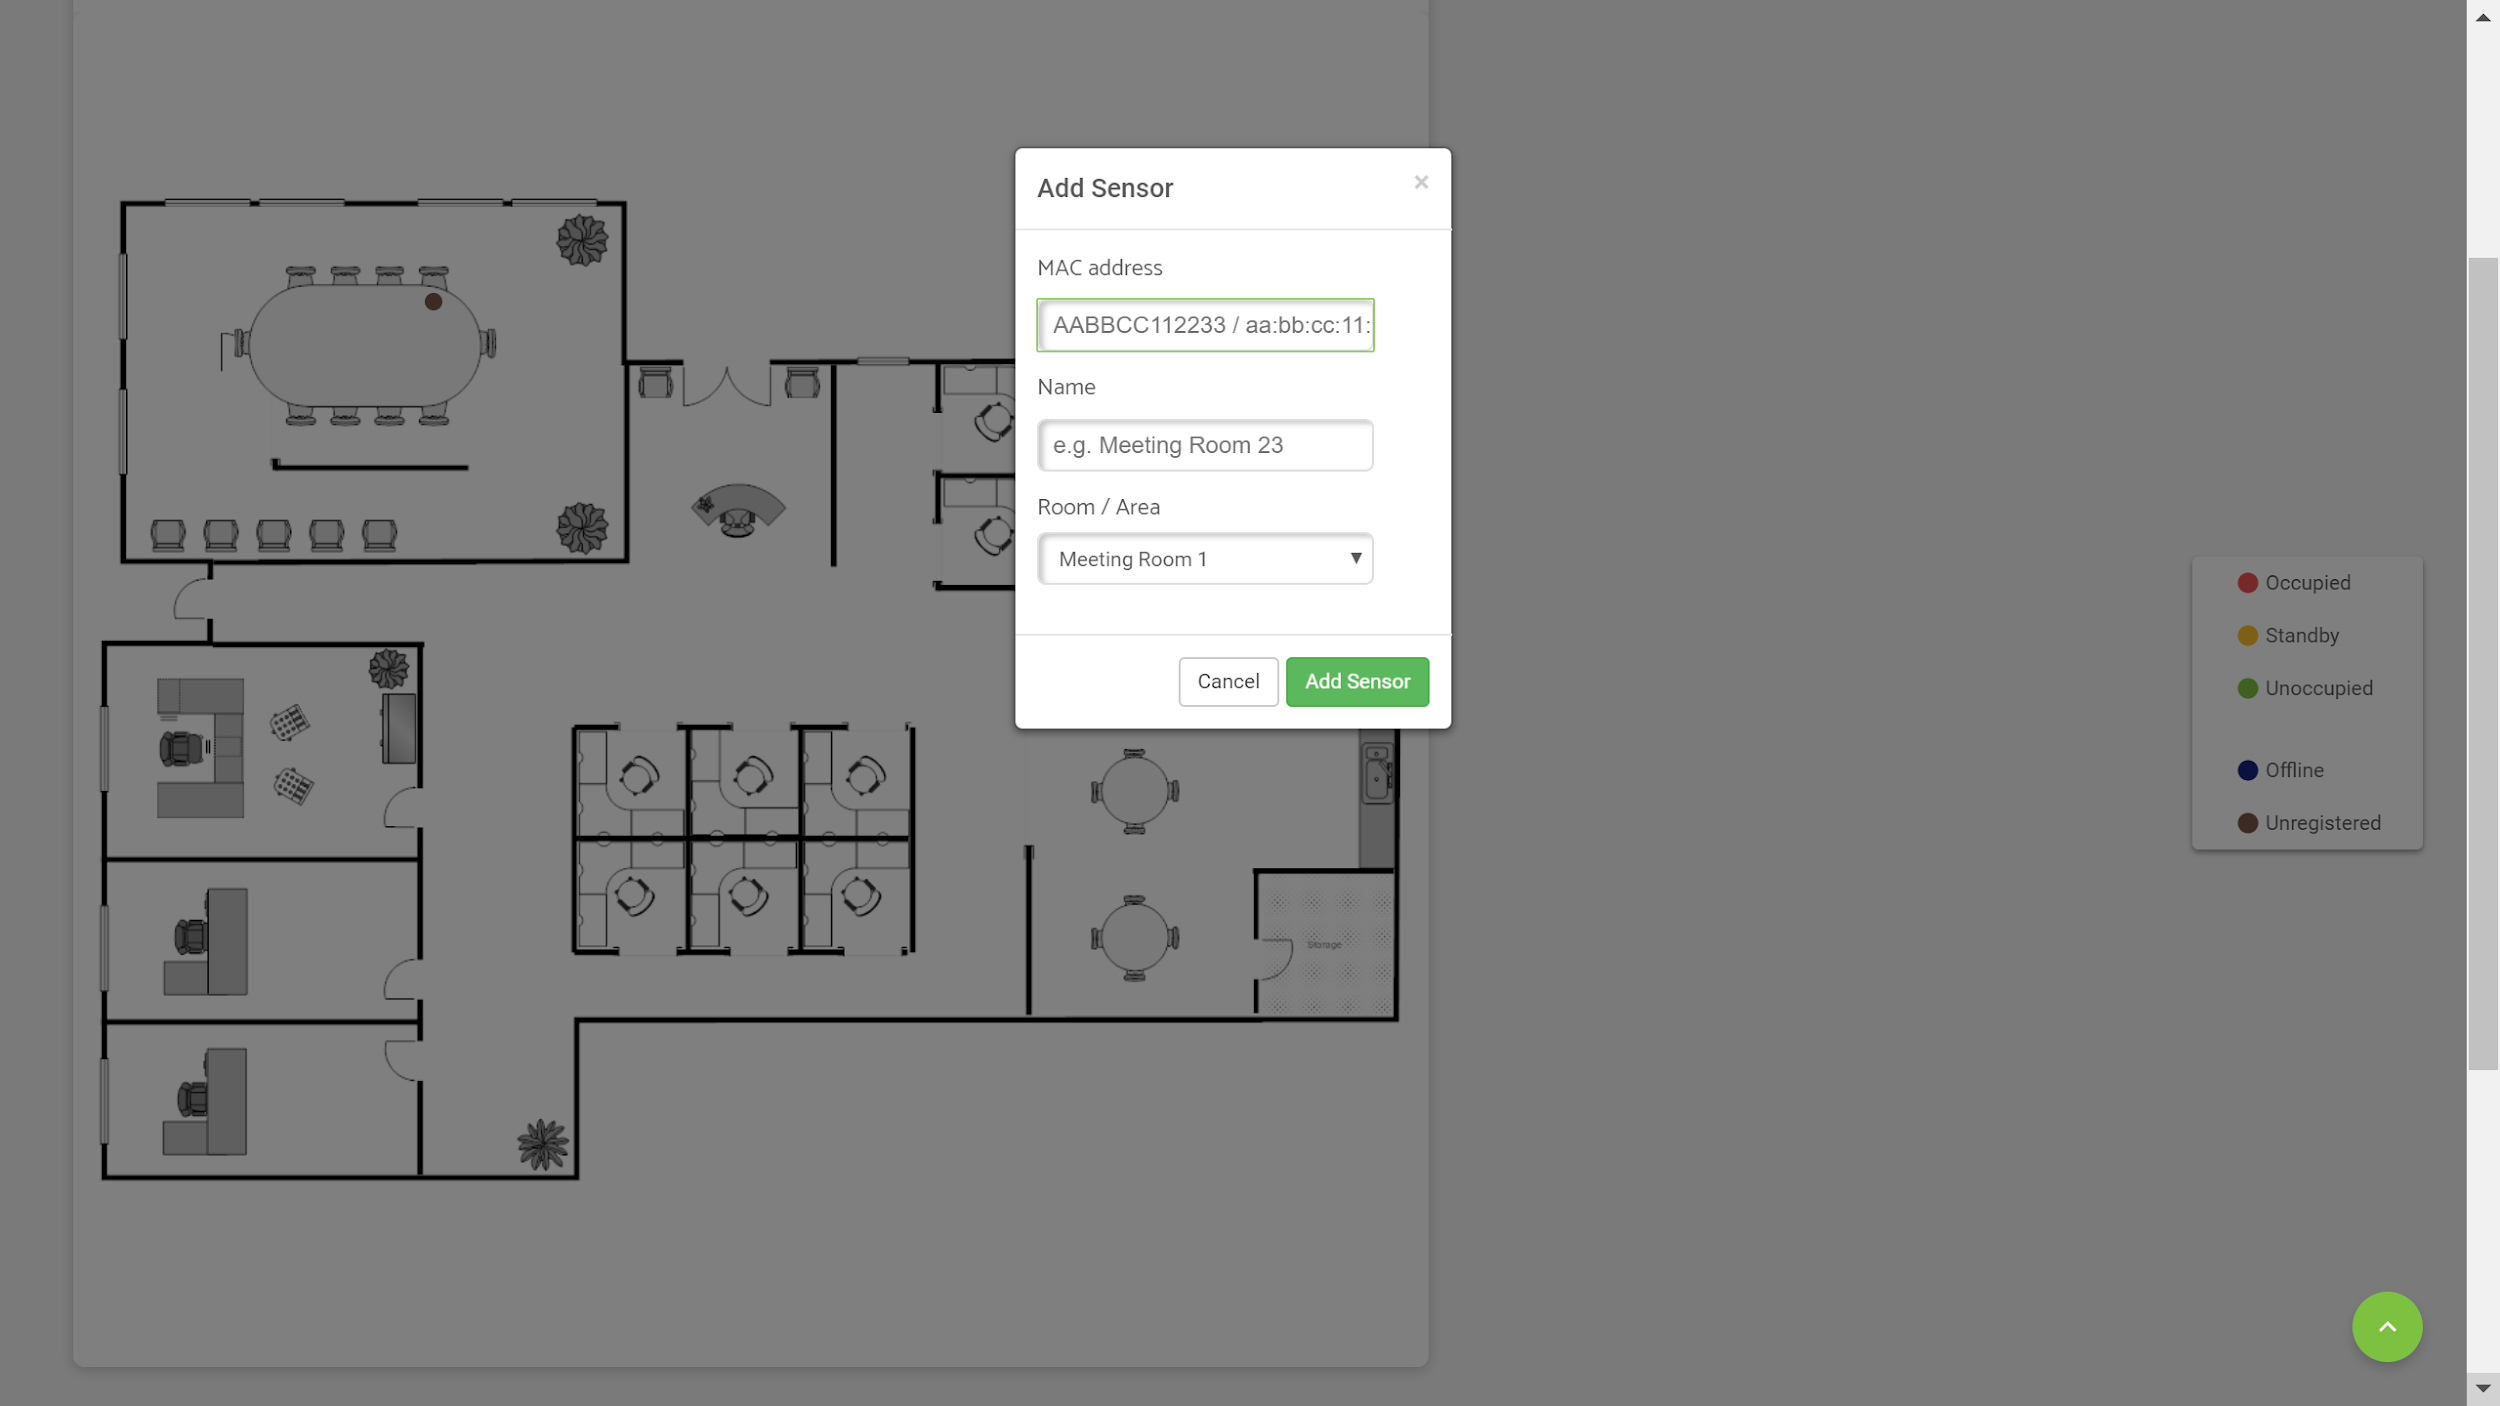
- MAC address: This is a 12-digit combination of letters and numbers attached on the side of sensors. Colon sign “:” is optional.
- Name: The field is optional; a name could helpful for the sensor’s troubleshooting.
- Room/Area: The location of sensors.
Sensor Settings
In this setting, users can monitor the behavior of sensors. It contains the following information:
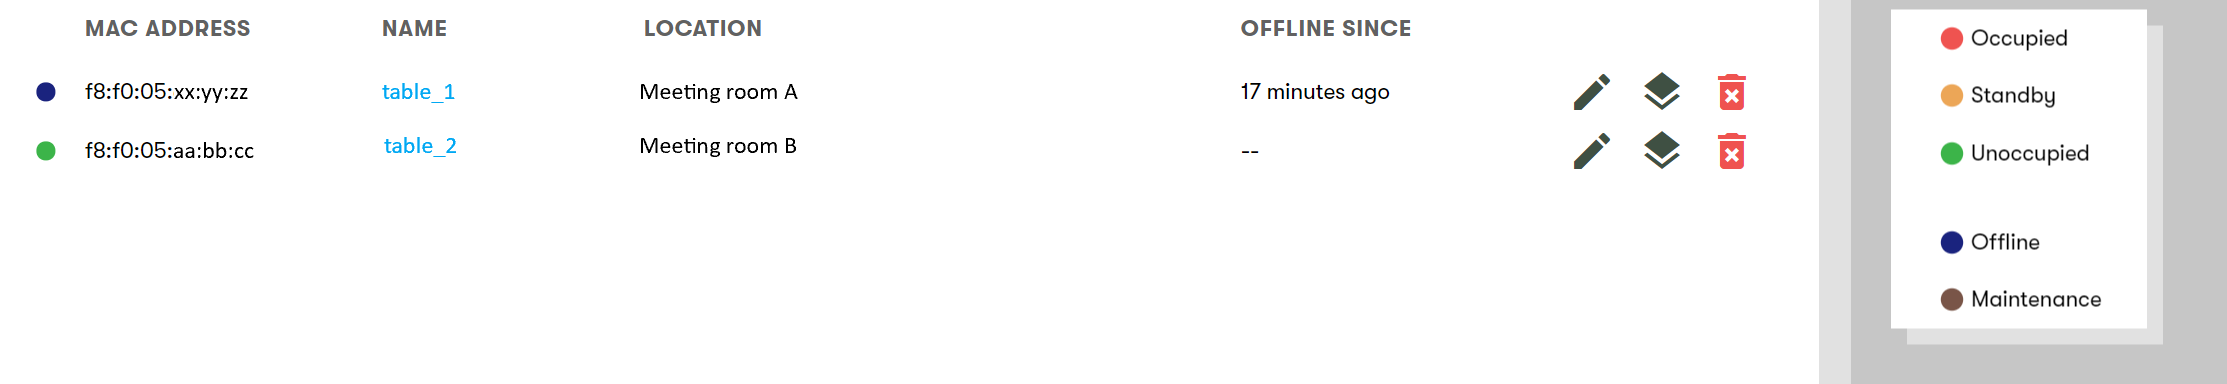
- Sensor status indicator: A different color represents a different status of the sensor
- Red: Occupied.
- Yellow: Standby/ The area is recently occupied. (Adjustable interval)
- Green: Vacant/Unoccupied.
- Blue: Offline/Temporary connection loss.
- Brown: Maintenance is required.
- Mac address: Unique 12-digit combination separated by “:”
- Name (Optional)
- Location
- Offline since: This information is only shown when the sensor is offline or requires maintenance.
 to edit sensors,
  to view the floor plan and
  to delete sensors.
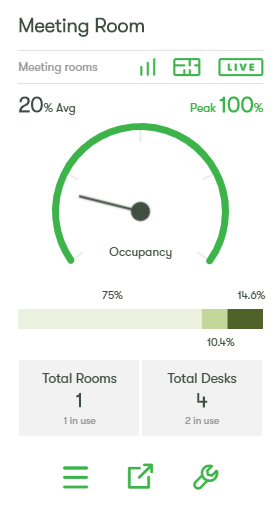
Data Overview
When there are sensors added, return to the Home page to add some locations. At this point, it depends on locations user want to showcase, here is an example of the display.
 |
|
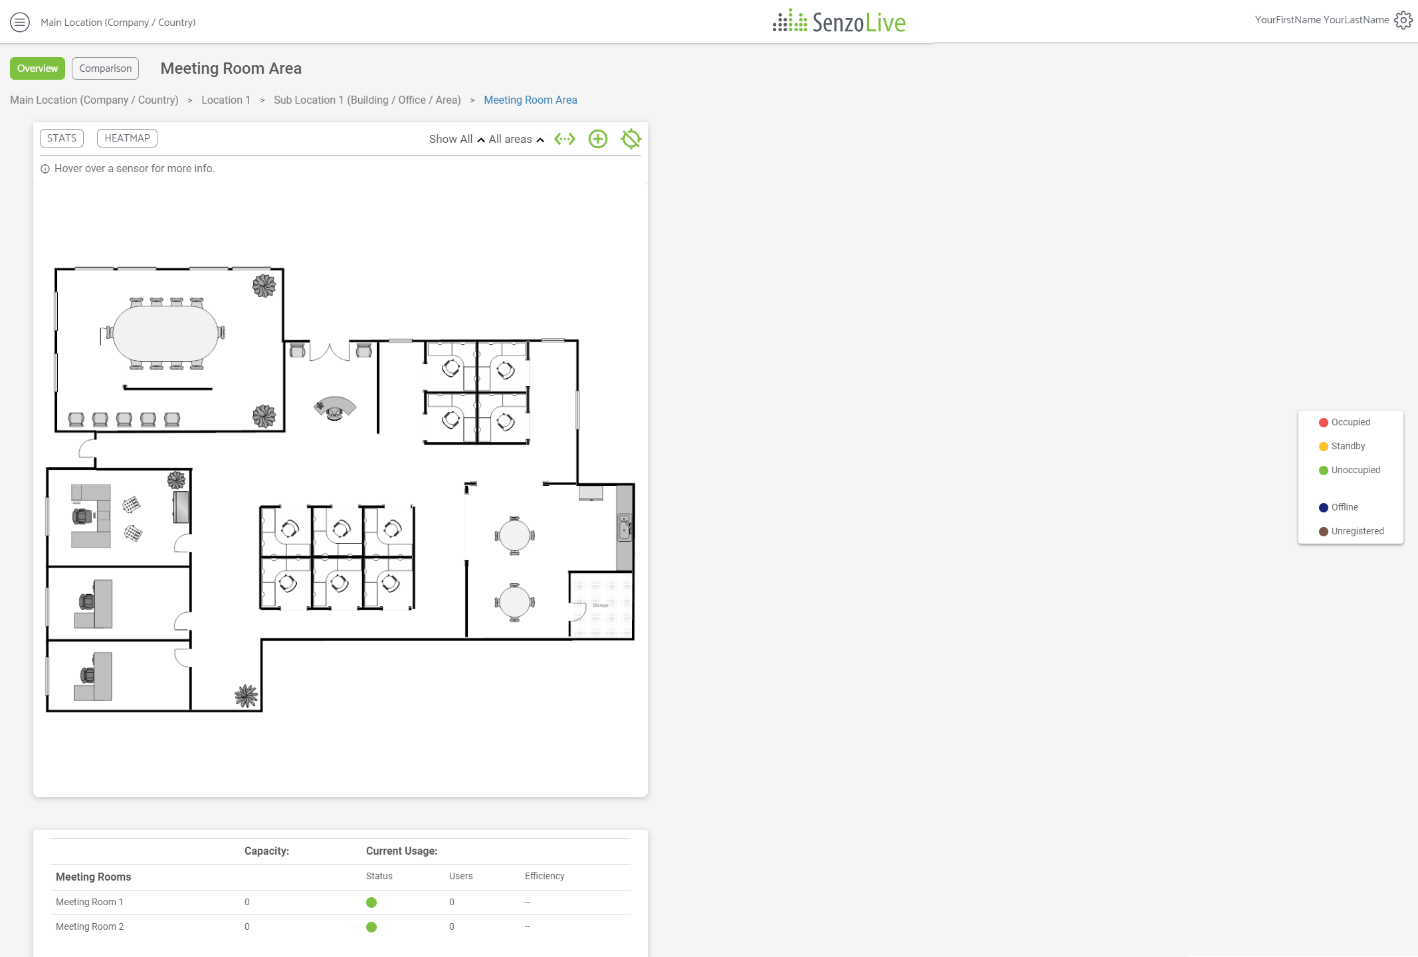
Live View
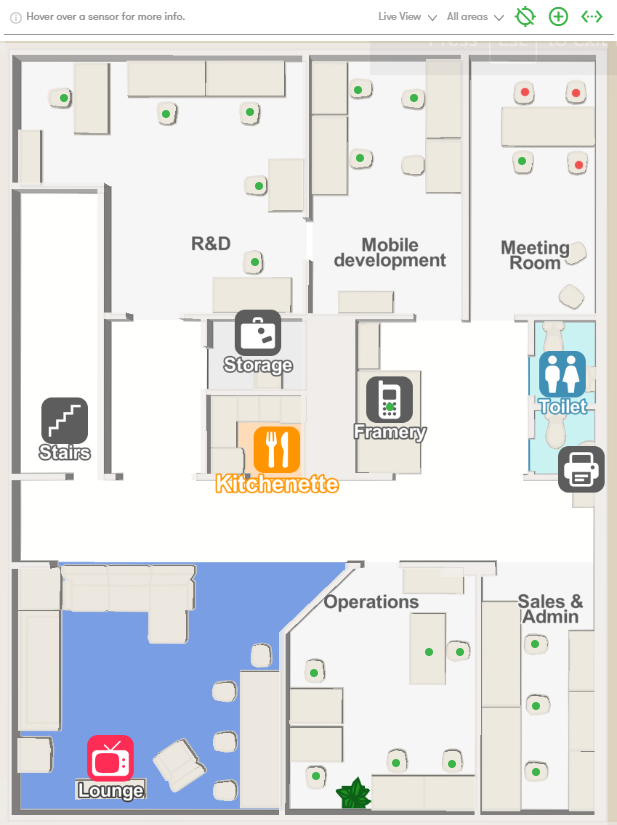 |
|
Heat Map
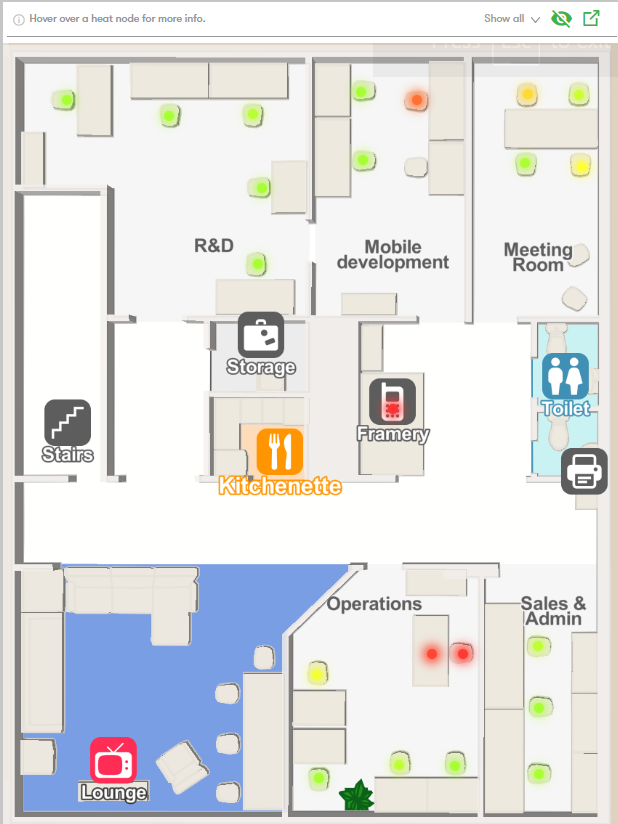 |
|
Analytics (Stats)
The statistic can be used to asset the occupancy and efficiency data of the whole location or each sub-location. There are 5 types of graphs for each type of data. The data range is selected on the top right corner in a day, week, month, year, or custom.
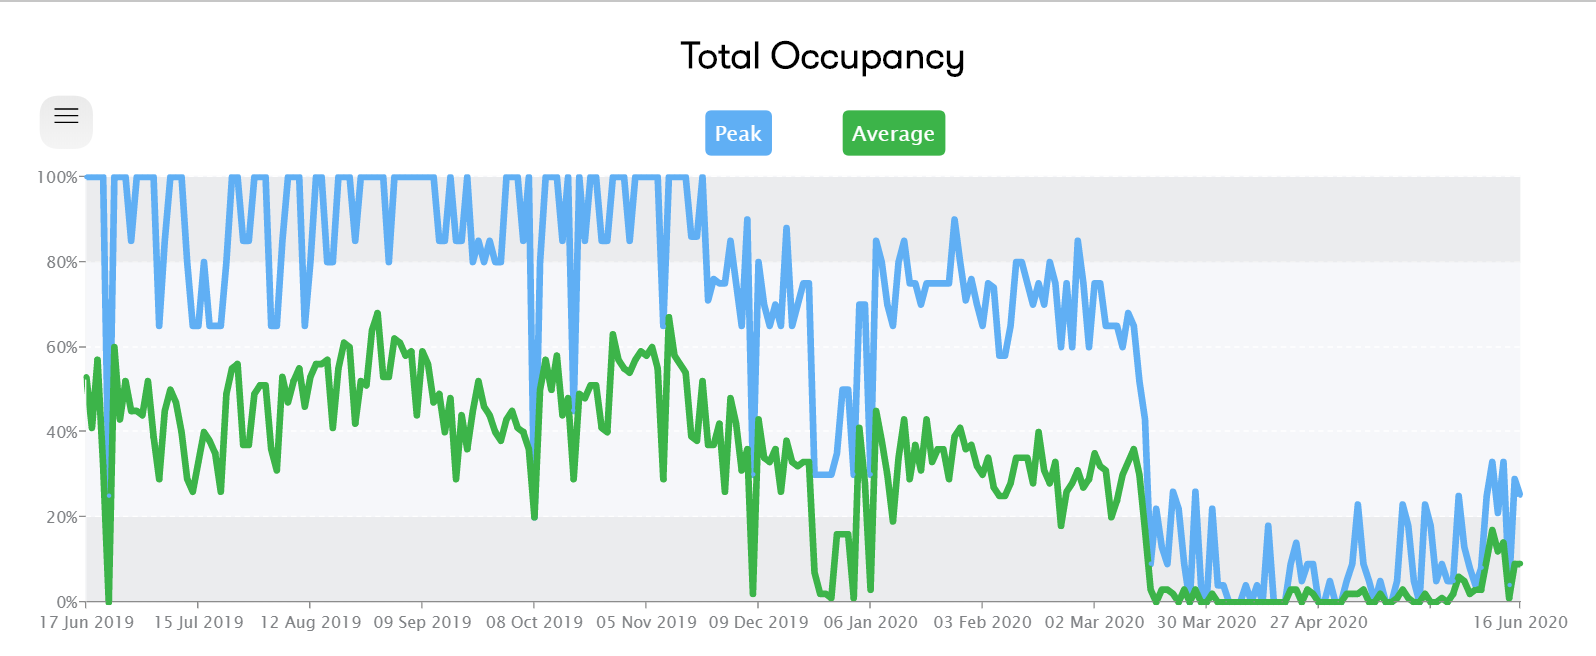
Total Occupancy
The line graph shows simultaneously peak and average occupancy usage of the customer’s site in a defined period of time. Users can turn off one of the lines by clicking on its box.
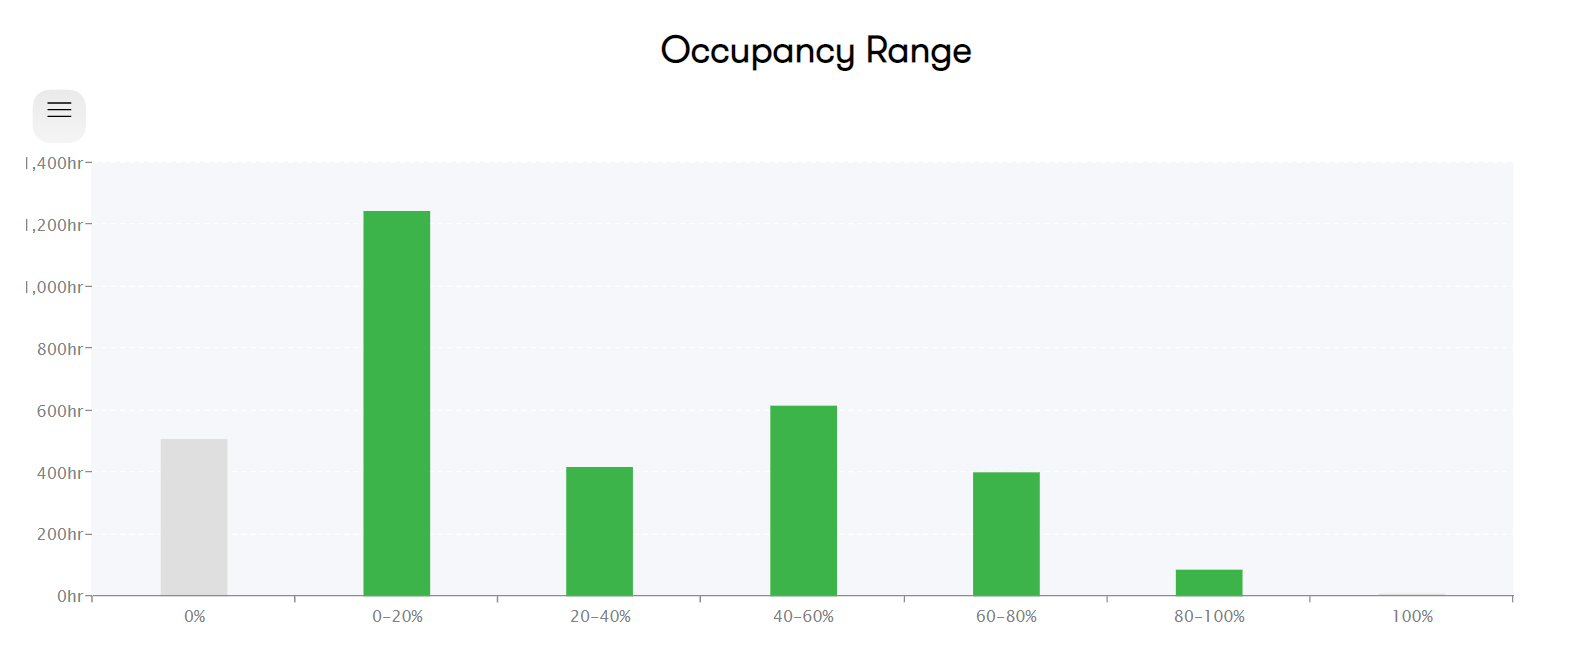
Occupancy Range
The bar chart shows how often the seats (in total) have been used (in percentage) and the number of hours in that range.
The ranges are 0%, 0-20%, 20-40%, 40-60%, 60-80% and 100%.
For example
(0%) Seats are unoccupied for 508 hours in total.
Up to 20% of all the seats in the office have been used for 1247 hours.
20%-40% of all the seats in the office have been used for 418 hours.
40%-60% of all the seats in the office have been used for 618 hours.
60%-80% of all the seats in the office have been used for 402 hours.
80-100% of all the seats in the office have been used for 88 hours.
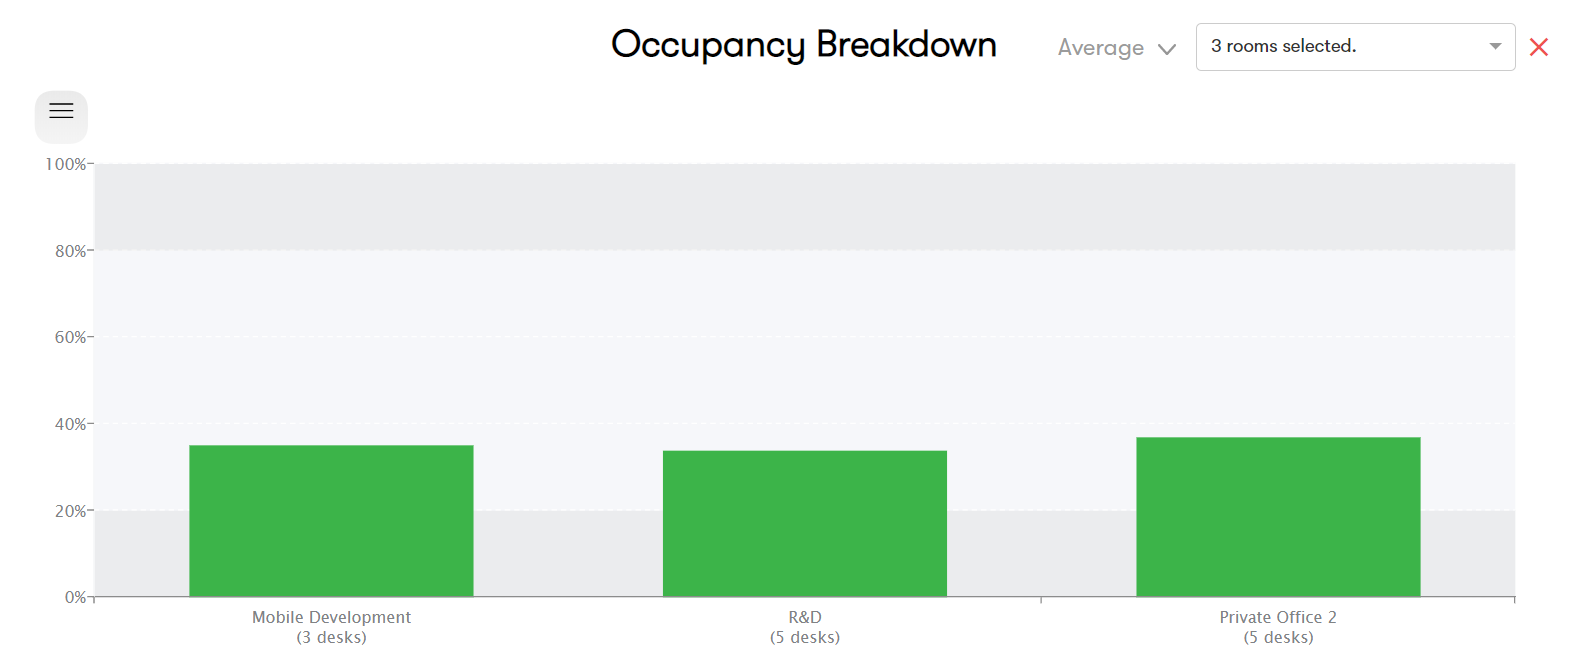
Occupancy Breakdown
The bar chart breaks down the peak and average occupancy usage of rooms.
More than one room could be added here for comparison.
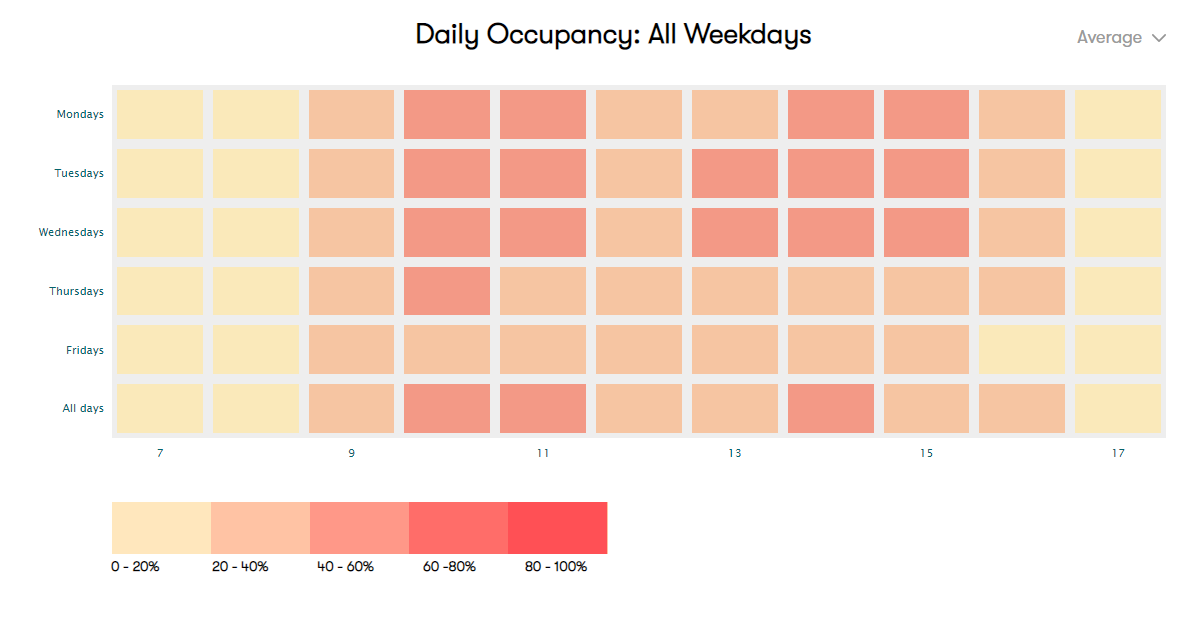
Daily Occupancy: All Weekdays
This graph is displayed as a heat map in working hour-day of the week coordinate. Each block represents data in one hour and a color chart is used to indicate the usage level.
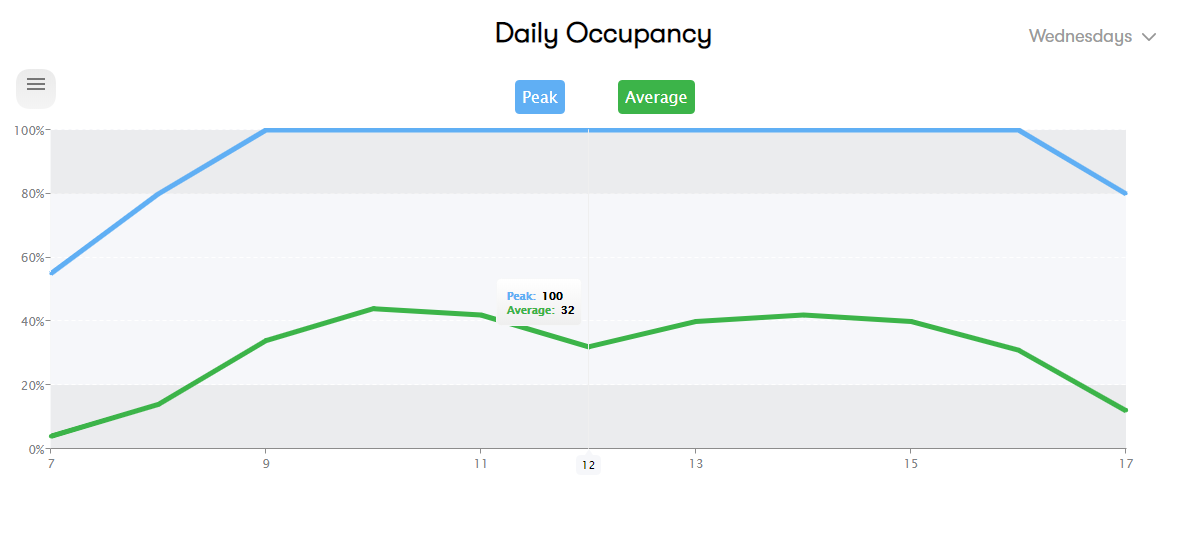
Daily Occupancy (Daily)
This graph is displayed as a line chart in the working hour-day of the week coordinate. The information is similar to the previous graph but in a way that shows the pattern change during a day.
Data analysis
Data export ![]() is located on Live widget and on the header of Stats
is located on Live widget and on the header of Stats ![]() carries the same function. Remember to choose the data range before exporting. It can be used to extract the data log of all sensors in a selected location into CSV format.
carries the same function. Remember to choose the data range before exporting. It can be used to extract the data log of all sensors in a selected location into CSV format.
“UnixTimestamp”: “1578996000” // Timestamp when the data is received.
“Time” : “2020-01-14 12:00:00 +0200 EET” // Human-readable time, which is based on the location.
“MACAddress”: “f8:f0:05:xx:xx:xx” // Unique MAC value of each sensor.
“SensorName”: “Name” // Defined sensor’s name on the dashboard.
“ParentName” : “Name” // The sub location where the sensor is located.
”Average”: “0.1333” // Average usage of sensors in one hour.
”Mask”: “406847492” // Data samples of every 2 minutes in one hour converted into binary.
“RecvMask”: “536870911” // The amount of data packets server received from the sensor in one hour converted into binary.
Copyright Steerpath. All rights reserved.
Comments
0 comments
Please sign in to leave a comment.